
win loss analysis logo

Win Loss Analysis: The Ultimate Guide for B2B Teams

Every company wins and loses deals. Very few companies know why. With win-loss analysis, companies can get real insights on every deal outcome, directly from your buyers.

By: Josh Kaestner

Updated Aug. 2026

63%

of companies with win-loss programs increased their win rates.

85%

of the loss reasons in your CRM are wrong.

97%

of companies with win-loss programs plan to maintain or increase that investment.

Based on Clozd research, see 2025 State of Win-Loss Report*

Introduction

Why do companies win and lose?

Every company wins and loses deals—but not every company knows why. Without a clear understanding of what’s driving your wins and losses, you’re just guessing. And guessing isn’t a strategy.

That’s where win-loss analysis comes in.

Win-loss analysis gives companies the clarity they need to make smarter decisions about sales, marketing, product, and strategy. It replaces opinions with facts, helps teams understand their buyers’ real perspectives, and uncovers the truth behind every decision.

Read on to learn what win-loss analysis is, why it matters, and how to build a program that helps your company win more often.


What is win-loss analysis?

Win-loss analysis is the process of capturing and analyzing feedback directly from your buyers to uncover the real reasons you win and lose sales opportunities. It’s the closest you can get to “game tape” for your business.

Just as elite sports teams review film to understand what worked and what didn’t, win-loss analysis helps organizations break down their past performance to improve future outcomes.

What win loss analysis reveals:

The real factors that drive deal outcomes

What buyers truly value—and what turns them away

How your competitors are positioned in your buyers’ minds

Where your messaging, product, or pricing strengthens or weakens your offer

Win-loss analysis is about both identifying problems (so you can fix them) and uncovering repeatable success patterns.

Companies that implement formal win-loss programs consistently report tangible business benefits. Gartner research shows that organizations with a rigorous, ongoing win-loss analysis see up to a 50% improvement in win rate and a 15–30% increase in revenue. Even small improvements in win rate compound into major financial gains.

Win-loss outcomes

Why win loss analysis matters

Most teams make strategic calls on assumptions, anecdotes, or CRM data that's incomplete. Your CRM records what happened—closed-lost, it rarely records why.

In fact, research by Clozd shows that buyer and seller reasons for lost deals align only 15% of the time. That means 85% of your “win-loss data” is unreliable if it’s coming from your CRM alone.

Most of the time reps will report the issue was pricing, but if your CRM is only right 15% of the time you don't really know if the loss was because of pricing, messaging, timing, missing features, or your champion lost the fight. A CRM can't get to the nuance of what happened, but a 25-minute interview can.

Without real win-loss feedback, companies:

Misjudge competitors and pricing pressures

Waste budget on ineffective messaging and campaigns

Miss product signals that buyers clearly articulate—but never to the sales team

Fail to identify win-back opportunities hiding in closed-lost accounts

When you start collecting feedback directly from buyers, everything changes. You get clarity about what’s driving outcomes, and your teams can finally act on truth, not speculation.

Here’s what consistent win-loss analysis reveals:

Competitive intelligence: Who your buyers really see as your competition (which is often different from what’s logged in your CRM)

Buyer priorities: The decision criteria that matter most in their purchase process

Product-market fit: Whether your solution truly aligns with buyer needs

Sales execution: Which behaviors, messaging, or pricing strategies close deals—and which lose them

Armed with that information, your go-to-market teams can confidently adjust strategy, prioritize product investments, and build a unified approach to winning more often.

Every professional sports team reviews their footage to understand where they need to improve. Winning deals is our sport, and Clozd is our video review. Everybody needs to be making every effort to get clients sharing feedback through their program."
Ravi Kumaraswami | President of Worldwide Field Operations
Building a win-loss program

How to conduct win loss analysis: A step-by-step process

Win-loss analysis is the activity. A win-loss program is the system that makes it repeatable—executive sponsorship, clear ownership, automated collection, and regular measurement.

Starting a win-loss program can seem like a monumental task, but for companies looking to start this section goes over everything you need to start.

We have identified these steps as important, because the best programs have these in common.

1

Step 1: Start with your existing data

Before you reach out to buyers, start by analyzing your own records. Look at your CRM data from the last 12 months:

Questions your CRM can answer:

  • What’s your overall win rate?
  • Which products or regions outperform others?
  • Where do deals stall in your funnel?
  • How do deal size and cycle length correlate with outcomes?

Even though CRM data isn’t perfect, it gives you a baseline to identify key patterns and segment your pipeline for deeper analysis.

2

Step 2: Define learning objectives

Win-Loss Analysis is typically framed as a way to grow revenue. When done holistically it can reach much further into blindspots every organization faces. Win-loss can expose gaps in marketing messaging, feature positioning, break points in the sales-to-CS handoff, and missing pieces in the product roadmap.

Many of these insights surface on their own as feedback comes in, and the Clozd Platform automatically identifies the themes and Decision Drivers behind them. Even so, the strongest programs start with a defined objective, whether that's growing revenue, sharpening positioning, or tightening a shaky handoff. A clear goal gives the program direction, aligns your stakeholders, and turns the feedback you collect into action.

Key principles:

  • Define a clear objective up front, tied to a decision your stakeholders are weighing
  • Collect holistically anyway: the Clozd Platform surfaces every theme and Decision Driver, not just the ones you set out to find
  • Keep the objective measurable, so you know when the program has delivered
3

Step 3: Secure executive cross-functional sponsorship

Real change only happens when senior leaders are close to it. Programs sponsored by the C-suite get the funding they need, drive change across departments, and return more.

Key principles:

  • Get buy-in at the top, then run it as a top-down initiative
  • Bring in the leaders of sales, marketing, product, and customer success early
  • Leaders involved in the setup are far likelier to act on the findings later
4

Step 4: Collect direct buyer feedback

This is where the real value begins. You can’t understand why deals are won or lost without asking the people who made the decision—the buyers themselves.

Clozd automates the entire feedback collection process—outreach, scheduling, incentives, transcription, and delivery—so your team can focus on applying insights rather than capturing them.

There are several channels to collect this feedback:

  • Live Interviews: The gold standard for high-value or strategic deals, these ~30-minute conversations uncover nuance and emotion that data can’t.
  • AI Interviews: Clozd’s proprietary AI Interviews allow you to capture feedback from a broader set of buyers—especially those from lower-value or early-stage deals—without compromising quality.
  • Surveys: Surveys can be useful for reaching a larger sample, tracking trends, and validating patterns you find in interviews.

Each channel has its trade-offs. Live Interviews yield depth and accuracy, while AI Interviews provide scale. A balanced program typically uses both.

Reps will seldom get true, honest responses as to why a deal was lost. Clozd steps in, acts as an unbiased third party, and walks through a detailed interview process with the client to know their reasoning. The detail we’ve received is outstanding.”
Shivang Patel | Senior Director of Growth & Strategic Initiatives
5

Step 5: Automate ongoing feedback collection

The reasons you win and lose keep changing. A program only keeps pace if collection runs continuously, not in bursts.

Key principles:

  • Buyer preferences and competitive pressures shift constantly
  • Build a long-term program, not a short-term fix
  • Enroll every closed deal in automated outreach as it closes

When you automate data collection, each closed deal triggers personalized outreach—email, SMS, phone—so participation stays high and your view stays current. In our 2025 State of Win-Loss study, only 39% of companies run win-loss as an ongoing, cross-functional program, up from 30% the year before but still a minority. That gap is the opportunity.

6

Step 6: Analyze and interpret the data

After collecting interviews, the next step is to identify your Decision Drivers—the key factors that influence whether you win or lose.

Key examples of Decision Drivers can be:

  • Product capabilities and differentiation
  • Pricing and perceived value
  • Sales rep performance or responsiveness
  • Brand reputation and trust
  • Implementation readiness or integration ease

Each decision driver can be tagged as positive (helped you win) or negative (contributed to a loss). Over time, you’ll see which factors consistently drive outcomes and how they change across segments.

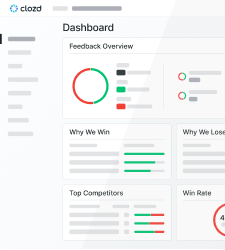
The Clozd Platform automatically categorizes and visualizes these insights, showing trending drivers, key quotes, and buyer sentiment. You can filter by competitor, region, or product line to drill deeper.

I like that we can filter the dashboard by wins and losses, drill down into categories, and see verbatim feedback that makes the data really actionable.”
Adella Jarvis | Senior Product Manager
7

Step 7: Share and operationalize your findings

The real power of win-loss analysis comes when insights are shared and acted upon. Clozd makes this easy by automatically distributing new findings through Slack, CRM integrations, or email alerts.

Why you should share findings widely:

  • Product capabilities and differentiation
  • Pricing and perceived value
  • Sales rep performance or responsiveness
  • Brand reputation and trust
  • Implementation readiness or integration ease

According to our research, 68% of companies that distribute win-loss insight across departments report a higher win rate. Automate delivery through Slack, CRM, and email so leaders get it in small, timely doses rather than one year-end dump.

Transparency ensures alignment—and turns feedback into action.

Who benefits from win-loss analysis?

Win-loss analysis benefits every major team in your organization:

Executives

Gain clarity and alignment, see which strategies actually drive revenue and where investment will have the biggest impact

Sales

Identify winning behaviors and improve coaching, understand where deals stall and how to counter objections effectively

Marketing

Validate messaging and positioning with real buyer language, refine campaigns based on what buyers say influenced their decisions

Product

Discover gaps and opportunities in your offerings, confirm which features differentiate you from competitors—and which don’t

Customer Success

Learn how pre-sale experiences affect retention and renewal rates

It's a cross-functional discipline that builds organizational confidence and coordination.

The entire leadership team is using win-loss insights—not just for sales or product, but also for customer success, engineering, and service. It’s matured into how the market perceives our entire experience.”
Deanna Ballew | SVP of Product
The value of win-loss analysis

What is the ROI of win-loss analysis?

Small changes in win rate compound into serious revenue. A team with $10M in quarterly pipeline and a 20% win rate that improves by two points adds $1M in new revenue a quarter—$4M a year, minus the cost of the program. That math is why 97% of companies already investing in win-loss plan to maintain or grow the investment.


The return on investment shows up consistently in our research. In our 2025 State of Win-Loss Analysis report we found the following:

63%

63% of companies with win-loss programs saw increased win rates

84%

84% of programs running for 2+ years reported sustained win-rate growth

85%

85% ongoing, cross-functional programs generated a positive ROI


We aren't alone in seeing the value of Win-Loss Analysis, here's what Gartner has to say:

A formal and rigorous win-loss analysis program enables better segmentation, product strategy, and sales enablement. Those that take a more comprehensive approach have seen a 15–30% increase in revenue and up to 50% improvement in win rates.
Todd Berkowitz | Research VP at Gartner


The honest tradeoff: those returns come from ongoing programs, not a one-time audit. The value builds as coverage grows—which is exactly the case for treating win-loss as a system, not a project.

If you're serious about optimizing your win-loss ratios and want data-driven insights to fuel your strategy, Clozd is a no-brainer. The upfront investment is quickly dwarfed by the immense value it brings in the form of actionable intelligence and competitive advantage.”
Dan Bolton | Vice President of Corporate Marketing
Building a successful program

Measuring success: KPIs to track

A successful win-loss program isn’t about collecting data—it’s about measuring progress and driving improvement.

Track these key indicators over time:

Win rate: The most obvious and direct measure. Even small gains deliver outsized revenue returns.

Sales productivity: Are reps closing faster or ramping up quicker?

Revenue impact: How much incremental revenue is attributed to win-loss insights?

Competitive performance: Are you winning more against top rivals?

Organizational adoption: How often are insights referenced in strategy meetings or planning sessions?


The following case studies show that mature programs have a clear impact:

AuditBoard leaned on win-loss data to refine their sales process—and then boosted their win rate by 5%.

Hello Heart identified a $500k win-back opportunity from a Clozd interview.

Clearbit attributed a 10% boost in retention to insights from Clozd.

How do you calculate a sales win rate?


Your win-loss ratio (i.e., your win rate) measures the percentage of deals your company closes successfully out of all opportunities pursued within a given period. It’s one of the simplest—and most telling—metrics for understanding sales performance and overall go-to-market effectiveness.

Simple win rate


We calculate win-rate in two ways, let’s start with the basic version:

Simple win-rate formula:(# of Won Deals / Total Opportunities) x 100 = Win Rate Percent


For example, if you won 50 of 200 opportunities in a quarter, you would plug it into that formula like this:

(50 / 200) x 100 = 25% win-rate

Weighted (revenue) win rate

While the simple formula shows how often you win, it doesn’t tell you how much revenue those wins represent. A weighted win rate gives you a better sense of revenue efficiency by focusing on the value of each deal rather than the count.

Weighted (revenue) win-rate formula:(Won Deal Value / Total Pipeline Value) x 100 = Weighted Win Rate Percent


To keep it easy, lets use the example from the simple formula. Assuming your 50 wins are worth $1M, and your losses represented $3M, you'd plug it in like this:

($1M % $4M ) x 100 = 25% weighted revenue.

In this case, your weighted win rate happens to match your deal count win rate—but that won’t always be true. If your team tends to win smaller deals and lose larger ones, your weighted win rate will be lower than your overall rate, signaling that you’re missing out on higher-value opportunities.

Why does calculating win-rate matter?

Calculating your win rate—both by deal count and by revenue—gives you a clear baseline to analyze trends:

Are your win rates improving or declining over time?

Are certain segments, industries, or product lines performing better?

Are larger deals harder to win, or are they trending upward?

Once you know these patterns, you can dig deeper with win-loss analysis to uncover the why behind the numbers—what differentiates your wins, where you’re losing, and how to increase both your frequency and value of closed-won deals.

Building a long-term win-loss culture

Ultimately, the goal isn’t just to collect data or generate reports—it’s to embed continuous learning into your company’s DNA.

When you build an ongoing win-loss program, you create a feedback loop that validates decisions, accelerates growth, and keeps your teams aligned around what truly matters: the buyer’s perspective.

You’ll start to see once-negative drivers turn into competitive strengths, and once-isolated insights turn into company-wide strategy.

“We took what used to be a reason we lose—and turned it into why we win.”
—Deanna Ballew, SVP of Product at Acquia

Win-loss analysis isn’t a one-time project, though. When done right, it’s a continuous, transformative process that keeps your company learning, adapting, and winning.

With the right partner, technology, and process, your win-loss insights can become one of your company’s most valuable strategic assets.

See our research and reports

Like a good win-loss program, our knowledge on win-loss analysis comes from over 60,000+ interviews conducted worldwide, and research conducted on real-life win-loss use cases. This guide was created with that in mind.  

Below you can read more about how the best win-loss programs are run, and what people are doing with win-loss.

How to build a world class win-loss program

This step-by-step playbook for standing up a win-loss program that actually leads to more wins for your business. It goes over the full setup and execution, from winning executive sponsorship, using the data already in your CRM, choosing the right feedback channels, automating collection, surfacing Decision Drivers, sharing findings organization wide, and measuring the return on investment.

What's inside:

A seven-part framework for building a program, not a one-off project

Why reps are wrong about why deals are won and lost 60–85% of the time

Gartner's finding that comprehensive programs see a 15–30% increase in revenue and up to 50% improvement in win rates

Practical benchmarks: reach saturation around 25–30 interviews per segment, and expect 15–30% participation for interviews versus 3–5% for surveys

Real playbooks from teams at Acquia, Alteryx, FloQast, Nitrogen, and Headspace

State of win-loss analysis report

The industry's longest-running win-loss study, now in its fifth year. Produced by Clozd and The Alliance, this year's report draws on more than 1,000 professionals across hundreds of organizations to show how the best programs are run and what results they deliver.

Key findings:

39% of companies now run an ongoing, cross-functional win-loss program, up from 30% a year ago

44% partner with a third-party provider, and those teams are over twice as likely to be satisfied with the depth of their feedback

72% of programs are owned by go-to-market teams, split evenly between sales and marketing

Ongoing programs see a positive ROI 85% of the time, compared with 55% for one-off projects

63% of companies report higher win rates, rising to 84% for programs running two or more years

97% plan to maintain or increase their investment next year

Learn more about how Clozd helps you uncover the real reasons you win and lose.

Talk with us

Win-Loss Analysis FAQs

What kind of ROI can I expect to see from win-loss analysis?
Companies that run ongoing win-loss programs typically see measurable revenue impact within the first year. According to industry benchmarks, organizations conducting consistent win-loss analysis for two years or more report an average 10–20% lift in win rate. Beyond new revenue, ROI comes from shorter sales cycles, improved competitive positioning, and fewer losses due to preventable misalignment between sales, product, and marketing.

Check out our ROI Calculator to see to how much you can increase your revenue through win-loss analysis with Clozd. Try it out for your whole pipeline or just a segment of your business. You can also connect with a Clozd win-loss expert to build out your own custom win-loss program and see what your specific ROI could be.
How do you make a win-loss chart using spreadsheets (Excel or Google)?
To create a simple win-loss chart, start by listing your closed opportunities for a given period with columns for outcome (won/lost), deal value, and key attributes like product, segment, or rep. Then use built-in chart options—such as a stacked bar chart or pie chart—to visualize your wins versus losses by category. You can also calculate your overall win rate with a basic formula:(Won Deals ÷ Total Opportunities) × 100. Adding filters for region, industry, or competitor gives you an instant visual of where you’re performing best.
What is the win or lose graph?
A win or lose graph (sometimes called a win-loss chart) visually compares the number or percentage of deals won versus lost. It helps teams spot trends—like which products, segments, or competitors drive the most outcomes—without needing to read through long tables of data. Win-loss graphs are often used in sales reviews or QBRs to quickly summarize performance across time periods or teams.
What is a good win-loss ratio for B2B SaaS?
A “good” win-loss ratio depends heavily on your industry, deal size, and market maturity. Many B2B companies aim for a win rate between 25% and 40%, though complex enterprise sales often land lower. What matters most is consistent improvement over time. If your ratio is 1:3 (one win for every three losses), the goal is to understand why you’re losing—and to move that ratio steadily upward through better qualification, messaging, and enablement.
Could a lost deal be a win?
Absolutely. A lost deal can be a win if it reveals insight that helps you close the next one. Win-loss interviews often uncover misalignment in messaging, unmet product needs, or buyer objections that can guide strategic improvements. In some cases, a “loss” also preserves valuable relationships or clarifies which customers are the wrong fit—saving time and money in the long run.
What is the win-loss factor?
The win-loss factor refers to the set of elements that most influence whether a deal is won or lost—such as pricing, product capabilities, timing, brand perception, or sales process. By categorizing these factors during analysis, teams can identify which ones drive the biggest outcomes and where improvements will have the highest impact.
How do you interpret your win-loss ratio?
A win-loss ratio measures the relationship between your wins and losses. For example, a ratio of 1:3 means you win one deal for every three you lose—a 25% win rate. Interpreting it correctly means looking beyond the number: which types of deals are you winning, and which are you losing? Context matters. If you’re losing small, low-margin deals but winning your ideal customers, a lower ratio can still reflect healthy performance.
What is win-loss analysis according to Gartner?
According to Gartner, win-loss analysis is the systematic process of capturing and analyzing feedback from buyers after a sales decision—both wins and losses—to understand decision drivers and improve go-to-market strategy. Gartner emphasizes combining quantitative CRM data with qualitative buyer interviews for the most complete insight into why deals are won, lost, or stalled.
What are some other tools and methods you can use to calculate your win-loss ratio?
You can calculate and visualize win-loss data using a range of tools—from simple spreadsheets like Excel or Google Sheets, to CRM data in platforms such as Salesforce or HubSpot. Many teams supplement this with customer interviews, surveys, or feedback platforms that reveal the reasons behind each outcome. Combining quantitative deal data with qualitative buyer insights gives you the most accurate view of performance. Platforms like Clozd automate this process by collecting structured feedback directly from buyers and integrating it into your analytics.